|
FSI Analysis of a Coriolis Mass Flow Meter
Coriolis mass flow meters (see Figure 1) are used for measuring the mass flow and density of liquids such as acids, chemicals, and gases. Coriolis mass flow meters can measure flows extremely accurately and for this reason they are often used to measure high value products or fluids that affect high value products.
|
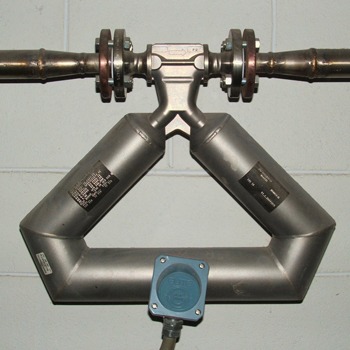 |
Figure 1 Typical Coriolis mass flow meter*
Coriolis mass flow meters use one or more tubes which are put in oscillation through an oscillation drive. In most recent designs the tubes are used pairwise. The tubes can be straight or U-shaped but can also have any other appropriate shape in order to produce enough Coriolis acceleration at prescribed tube locations.
The operation of a Coriolis mass flow meter is illustrated in Figure 2. If there is no flow in the tube, there is no Coriolis effect. The oscillation frequency of the tube is then used to measure the density of the fluid. When there is flow in the tube, the Coriolis effect causes an additional twist on the tube which produces a small phase shift in the displacement signals of the sensors. This phase shift is then used to calculate the current mass flow.
|
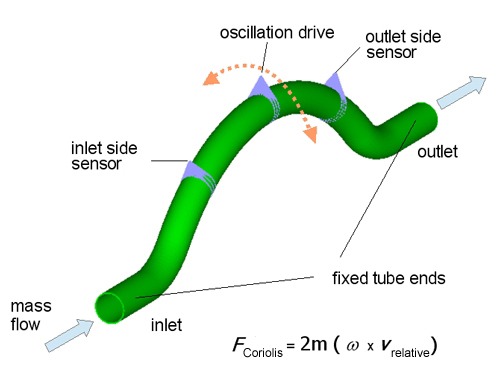 |
Figure 2 Principle of operation
An important design task in Coriolis mass flow meter development is to find out how the frequency and phase shift depend on temperature, pressure and viscosity. Today, limited models of structures with point masses to represent the fluid and discrete damping forces to represent the Coriolis effects are largely used — although the phenomena to be studied are very sensitive to a realistic representation of the physical situation. On the other hand, ADINA can be used to study flow meters accurately with remarkable mechanical consistency, i.e., without the usual limitations used in simplified models.
As the following example shows, ADINA, with its unique capability for solving fluid-structure interactions can be used to model the device with many details quickly and reliably in a totally virtual environment. Many other important effects, e.g., from manufacturing processes, can be successively included in the model.
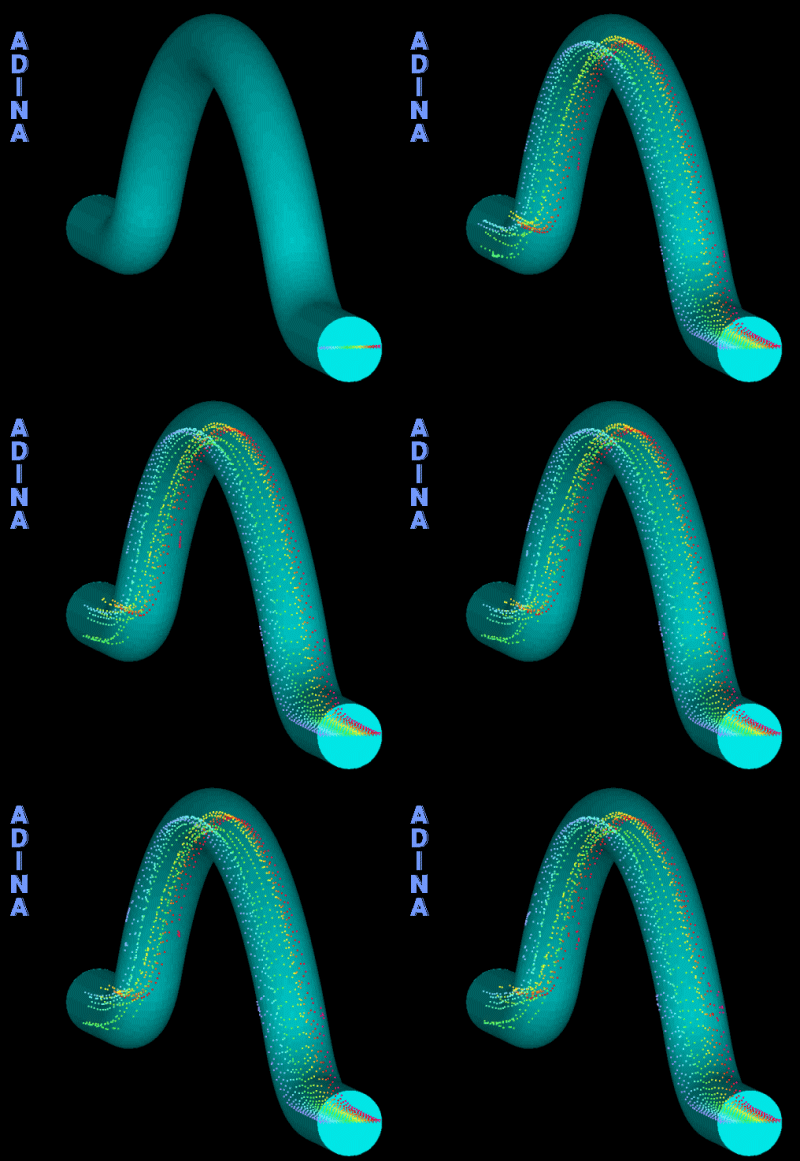
The figures below and the movie above show a set of results obtained by Dr. Thomas Chatzikonstantinou, Aachen, Germany, using ADINA. Two fluid-structure interaction models were used:
- Filled tube without inlet velocity
- Filled tube with inlet velocity of 10 m/s
The model was set up using 3D solid elements for the tube and FCBI-C elements for the fluid, and solved fully coupled with the Bathe implicit time integration.
Figures 3 to 10 show details of the mesh at the inlet, and results. |
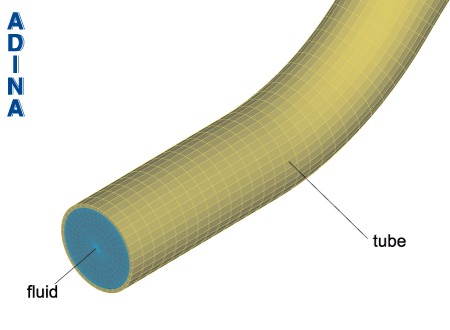 |
Figure 3 ADINA FSI model of Coriolis mass flow meter tube: detail at inlet |
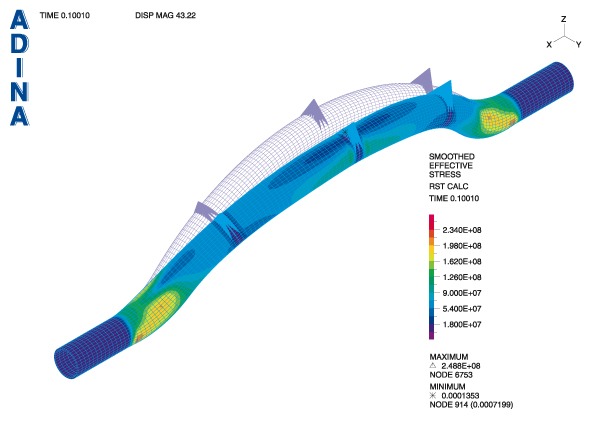 |
Figure 4 Filled tube with no flow: effective stress in the tube |
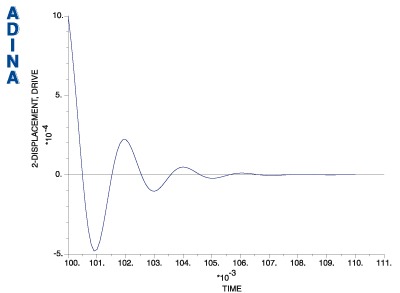 |
Figure 5 Filled tube with no flow: free oscillation signal at drive model point |
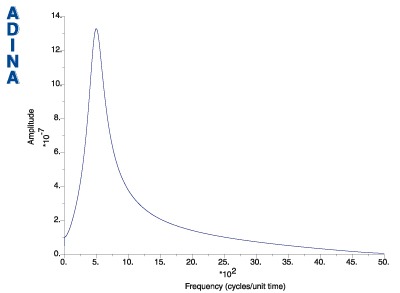 |
Figure 6 Filled tube with no flow: Fourier analysis of free oscillation signal at drive model point |
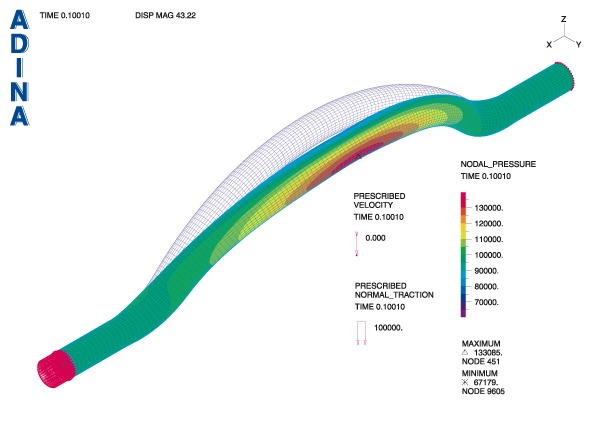 |
Figure 7 Filled tube with no flow: nodal pressure in the fluid
|
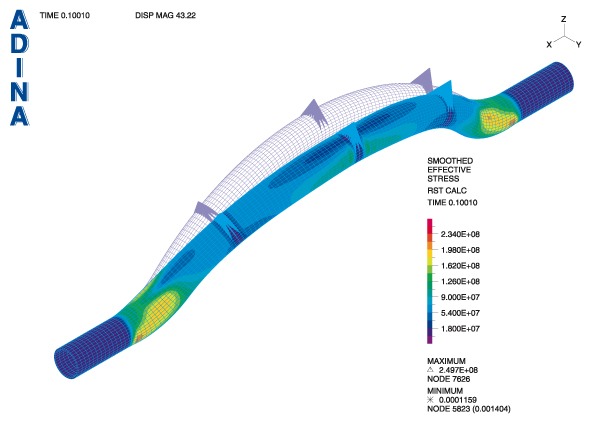 |
Figure 8 Filled tube with inlet velocity of 10 m/s: effective stress in the tube |
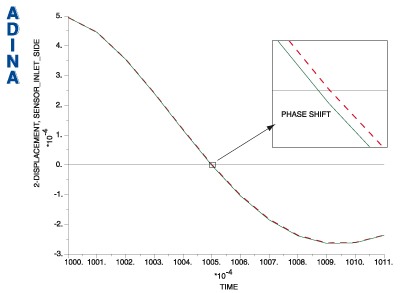 |
Figure 9 Filled tube with inlet velocity of 10 m/s: Phase shift of sensor displacement signals
(green: sensor inlet signal, red: sensor outlet signal) |
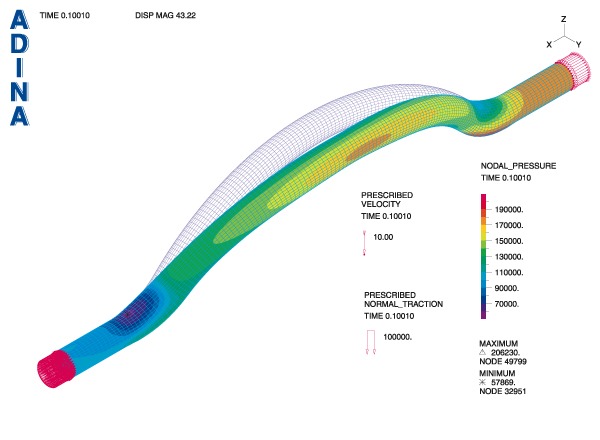 |
Figure 10 Filled tube with inlet velocity of 10 m/s: nodal pressure in the fluid
An important point is that the phase shift seen in Figure 9 should be predicted accurately. ADINA is a powerful tool to achieve excellent accuracy in the analysis.
For more information on the ADINA FSI capabilities, refer to our page fluid-structure interaction capabilities of ADINA.
Keywords:
mass flow meter, Coriolis, fluid-structure interaction, FSI |


FSI Analysis of a Coriolis Mass Flow Meter
Coriolis mass flow meters (see Figure 1) are used for measuring the mass flow and density of liquids such as acids, chemicals, and gases. Coriolis mass flow meters can measure flows extremely accurately and for this reason they are often used to measure high value products or fluids that affect high value products.
Figure 1 Typical Coriolis mass flow meter*
Coriolis mass flow meters use one or more tubes which are put in oscillation through an oscillation drive. In most recent designs the tubes are used pairwise. The tubes can be straight or U-shaped but can also have any other appropriate shape in order to produce enough Coriolis acceleration at prescribed tube locations.The operation of a Coriolis mass flow meter is illustrated in Figure 2. If there is no flow in the tube, there is no Coriolis effect. The oscillation frequency of the tube is then used to measure the density of the fluid. When there is flow in the tube, the Coriolis effect causes an additional twist on the tube which produces a small phase shift in the displacement signals of the sensors. This phase shift is then used to calculate the current mass flow.
Figure 2 Principle of operation
An important design task in Coriolis mass flow meter development is to find out how the frequency and phase shift depend on temperature, pressure and viscosity. Today, limited models of structures with point masses to represent the fluid and discrete damping forces to represent the Coriolis effects are largely used — although the phenomena to be studied are very sensitive to a realistic representation of the physical situation. On the other hand, ADINA can be used to study flow meters accurately with remarkable mechanical consistency, i.e., without the usual limitations used in simplified models.As the following example shows, ADINA, with its unique capability for solving fluid-structure interactions can be used to model the device with many details quickly and reliably in a totally virtual environment. Many other important effects, e.g., from manufacturing processes, can be successively included in the model.
The figures below and the movie above show a set of results obtained by Dr. Thomas Chatzikonstantinou, Aachen, Germany, using ADINA. Two fluid-structure interaction models were used:
- Filled tube without inlet velocity
- Filled tube with inlet velocity of 10 m/s
The model was set up using 3D solid elements for the tube and FCBI-C elements for the fluid, and solved fully coupled with the Bathe implicit time integration.Figures 3 to 10 show details of the mesh at the inlet, and results.
Figure 3 ADINA FSI model of Coriolis mass flow meter tube: detail at inlet
Figure 4 Filled tube with no flow: effective stress in the tube
Figure 5 Filled tube with no flow: free oscillation signal at drive model point
Figure 6 Filled tube with no flow: Fourier analysis of free oscillation signal at drive model point
Figure 7 Filled tube with no flow: nodal pressure in the fluid
Figure 8 Filled tube with inlet velocity of 10 m/s: effective stress in the tube
Figure 9 Filled tube with inlet velocity of 10 m/s: Phase shift of sensor displacement signals
(green: sensor inlet signal, red: sensor outlet signal)
Figure 10 Filled tube with inlet velocity of 10 m/s: nodal pressure in the fluid
An important point is that the phase shift seen in Figure 9 should be predicted accurately. ADINA is a powerful tool to achieve excellent accuracy in the analysis.For more information on the ADINA FSI capabilities, refer to our page fluid-structure interaction capabilities of ADINA.
Keywords:
mass flow meter, Coriolis, fluid-structure interaction, FSI